

The average attention span of humans was 8 seconds in 2021. With the boost in digitalization and the extent to which our lives revolve around it, we think it has further gone down. It also means that content creation and content marketing have become even more challenging. So your content needs to be highly relevant, easy to grasp, and entertaining in order to grab and hold your audience’s attention. This is why video content and infographics have become a popular choice for sharing information.
Visual content is 40% more probable to be shared on social media than other remaining types of content. Colorful content increases the viewer’s willingness to read by 80%. The visually compelling creations work well because they draw on the naturally compelling nature of imagery. The way you share critical details with your audience in a visual format is called information design. Infographics are just one example of many different types of information design. It’s critical to understand the primary objective of these pieces. Then you frame and format your information design as you wish.
Informational designs can communicate your message in a single glance. The data and text on the piece only tell half the story. Colors, typography, and imagery will further add to the information. Whether you’re looking for a way to say more with fewer words or something to strengthen your rebranding logo and style, information design will be vital in getting the job done.
Did you know that Infographics was discovered around 2012, but by 2016, they absolutely became obsolete?
How can something so informative and easy to understand become obsolete? It was due to the rampant use of infographic services, without regarding the content or the topic. Almost in every content designing meeting, infographics were the final decision. The format first approach Link builders abused the format to the highest extent, hence it became saturated. And then at around 2016, almost every top-tier firm stopped producing infographics in the same frequency as they had been publishing it in prior years.
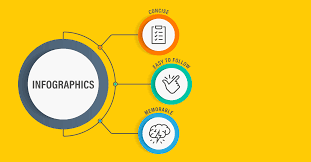
Despite that, infographics continue to be widely used across organizations to create successful content pieces. Here are some benefits of using infographics:
- Visuals always have a higher edge over text
According to reports, the human brain processes visuals 60,000 times faster than text. We’ve been swamped with information as content consumers in recent years. While there are times when a 10,000-word guide is required, this isn’t always the case.
Data has a bad reputation for being bland and uninteresting to most of us; however, when visualized, it can take on a new form and attract those who would not read it in another format.
- Infographics are easy to interpret
Not everyone has the time or inclination to read long-form content. However, there’s no reason why you can’t use infographics to complement your other content efforts. Why are infographics effective? Because it not only illustrates the advice given in the text but also allows the reader to refer to it visually. The infographic contextualizes the content, making it easier to understand and enforce.
Don’t always assume that content formats should be used separately. Use them in combination to increase reader engagement and provide consumption options.
- Infographics are easy to share
They’re a great way to share information with others, whether it’s on social media, among team members, or even within blog posts and articles. Indeed, 80% of marketers use visual assets in social media marketing. Tweets with images receive 18% more retweets than tweets without images. Take into account slicing your infographic into social-sized cards that can be shared on social media. This is an excellent way to repurpose content and increase engagement with it.
When it comes to content marketing, financial service brands face some specific challenges. The strict guidelines and complex subject matter make it difficult to connect with the audience, in the rapidly changing industry.
The biggest challenge financial companies face while marketing their products are,
- Reaching the right audience
- Keeping up with the competition
- Generating traffic and leads
However, financial services firms have access to a vast amount of data, whether it is industry statistics, customer figures, market trends, or other financial information. This information can be used to create visually appealing content for their content marketing. Since human beings grasp visuals better, visual content is highly effective at making your message retainable.
Infographics provide a personalized edge. Companies across industries provide personalized digital experiences to their consumers. Hence, they become more conscious when a company does otherwise. Consumers don’t just compare bank to bank, or one insurance provider to another, they compare the online experience they encounter. Infographics communicate services and information in a more personalized way to consumers.
Where can financial firms include infographics?
- Manuals, guides, and eBooks – Be it a five-year-old kid or a fifty-year-old man, visual content is better grasped and retained. So if a financial firm uses infographic services while explaining a service or a product, it is imperative that the prospective customer will have a better understanding of the service. The easier the comprehension, the higher is the probability of the potential customer becoming a loyal customer.
- Videos – Video is a powerful and rapidly growing content format. Including video in your B2B marketing strategy is a compelling way to present data in a way that is understood and accepted by your target audience. Videos are especially useful for more difficult financial topics, hence using voice and visuals becomes helpful. Infographics and comics always give a simplistic outlook to concepts. So preparing a video with infographics will further simplify explanations and improve understanding of the topic.
Why should infographic services be included by financial companies?
- Infographics portray you as an expert
Since infographics are shareable and linkable, they’re a good way of establishing yourself as an expert as long as the proper distribution strategy is in place. You can check the linkability, with a free backlink checker.
Prepare a series of informative and engaging infographics, pair them with a solid outreach strategy, and watch your engagement skyrocket.
- Increases brand awareness
A good infographic can become viral with a single click. So if you include your brand design and logo in the infographic, people can associate your brand with knowledgeability and professionalism.
- Higher engagement
Infographics immediately convey the way your product or services can impact the consumer, making it far more compelling than written bullet points. Hence people feel compelled to respond to their visual stimuli, which in turn increases your brand engagement with customers.
- Higher sales probability
So as a financial services brand if you want to show your customers what you provide, how can you use it as an infographic?
Instead of writing benefits, sum assured, interests and comparing it with other services, using infographic services will instantly convince your potential customers as to why they should choose your service. An infographic doesn’t always have to be a PR tool, use it to educate your prospects in a visual way.
- Higher SEO ranking and website traffic
The easier to grasp your infographics are, the higher will be the traffic on your website. Higher traffic means more inbound links, and therefore a boost in your website’s SEO ranking. You can even check your backlinks with a free backlink checker.
Type of Infographics a financial company can use
Infographics come in a variety of shapes and sizes. When creating an infographic for your company, it’s critical to determine the best template for your needs. Begin with some of these well-known and highly relevant options
- Flowchart
Generally, a flowchart depicts the decision-making process for a particular question with various endpoints. While creating a question and answer flowchart is a time-consuming process, this type of infographic is extremely engaging since it provides personalized answers to each viewer.
How should financial companies prepare infographics? You can use a flowchart for topics like, ‘How to choose the correct insurance plan for your family?’ or ‘Which plan suits you best according to your income?’
- Comparison
Comparison infographics display two concepts alongside to show how they contrast. This is an excellent choice for a financial infographic because it allows you to compare your product with your competitors while highlighting where yours differs. If you have a number of similar products or services, you could use this type of infographic to demonstrate how they differ.
- Timeline
Timelines are exactly what they sound like. They demonstrate the evolution of a product or concept over time.
You can use a timeline to demonstrate how your products have become more customer-friendly over time, or how the long line of ever-improving technological developments has brought your financial services to your customers’ fingertips.
- How-to
How-to infographics can take several forms. In cases where there is only one primary path to completion, you can provide a step-by-step explanation. This style could be used for an infographic on how to choose the correct educational plan for your child. A how-to infographic can also provide a more versatile look at your subject. When discussing how to choose the correct home-loan and car-loan plan together, the topic becomes more open. Since there are many possible answers to the topic, your how-to will not be a simple step-by-step, but rather a more informative piece with several options all along.
- Data Story
An infographic data story is a very adaptable design style. This works best when presenting a collection of facts and statistics. When you want to share the findings of your study on social media trends, you could use a data story infographic. This type of piece could evaluate the demographics of your loan-taking customer group. This is a versatile option that can be applied to a variety of topics.
- Metaphor
While any infographic can include clever metaphors, some rely on a single metaphor throughout. Perhaps you’re displaying how to identify the best education loan is like playing a game of chess. This is a difficult technique to master, but when done well, you’ll have an intriguing and highly shareable piece.
Steps financial firms should follow while creating infographics
Infographics are a valuable marketing resource for any financial business. Even if you want to outsource most of the content creation to a professional for a more polished look and experienced approach, understanding the overall process is beneficial whether you’re doing it all yourself or not. When making infographics for your financial services firm, you should usually go through the following steps:
- Determine your goal: What do you hope to achieve with this infographic? Are you looking to inform your customers about a new product, help your sales team understand their target audience, or provide a how-to for a new complicated service? Outline your piece’s audience and goal earlier than usual.
- Choose a topic: Determine the specific topic of your infographic. Create a working title and a brief description of the infographic’s topic.
- Collect the data: This is a critical step in the infographic creation process. You must use trustworthy and informative sources. Unless you’re looking for a short quote to call out in a speech bubble, opinionated blog posts won’t serve the purpose of most infographics. If your topic appears to lack research, consider conducting your own research to fuel the infographic formation.
- Create a storyline: Outline your infographic narrative and list the key facts you’ll include in the piece. This is the stage at which you’ll determine which narrative style is best suited to your project. Is this a timetable or a step-by-step guide? Make sure you understand the format of the piece.
- Establish your style and branding: What colors, typography, and image style are you planning to use for the piece? Where will you display your logo? Will you include live images, cartoons, or other graphics? Before you start designing the final piece, identify these creative elements.
- Create the infographic: This final step will bring together all of your previous work on the project, resulting in a finished piece that is worthy of posting and sharing for the purposes of your business.
Creating infographics necessitates a lot of consideration and research, followed by excellent organization and design. If done correctly, your infographic will be a valuable piece of content for a variety of marketing campaigns. You can include it in your blog, social media, whitepaper, and other places.
Tips to prepare great financial services business infographics
Since infographics are rapidly gaining popularity, you’re almost surrounded by competitors who are using them as enthusiastically as you are. It’s critical to keep a few best practices in mind as you enter this space. Follow these guidelines to ensure that your infographics are engaging, well-designed, and sharp.
- Reduce the amount of text used in your template.
- Avoid using overused templates.
- Look for unique topics.
- Conduct your own research to find never-before-seen information.
- Make it shareable by including social media widgets and callouts that are optimized for each site.
You can create outstanding infographics that will make an impact wherever they’re displayed with a thoughtful approach and a lot of attention to detail.
Conclusion
Infographics aren’t obsolete; they’ve simply been misunderstood and misapplied for a long time. When used correctly, they are still a wonderful format that can bring fantastic benefits as part of a larger content marketing strategy.